Akeneo Product Cloud
 Summer Release

Akeneo’s Summer Release is Bringing the Heat
Managing product data has always meant more manual work, more complexity, more bottlenecks. Akeneo’s Summer Release flips that script. With the arrival of Agentic Ziggy, an AI operational layer that understands your goals and helps execute them, teams can finally move from maintaining information to acting on it. Here’s everything that’s new, and why it changes the game.
Summer is the season of momentum.
It’s when businesses prepare for peak selling periods, launch new campaigns, and look for ways to move faster without sacrificing quality. But for many product teams, the reality is that managing product information, syndicating content, and preparing assets for every channel can still feel like a manual, time-consuming process.
That’s why we’re excited to introduce Akeneo’s Summer Release 2026, a release designed to help organizations work smarter, move faster, and unlock a new era of product experience management.
Welcome to the era of the Agentic Product Cloud.
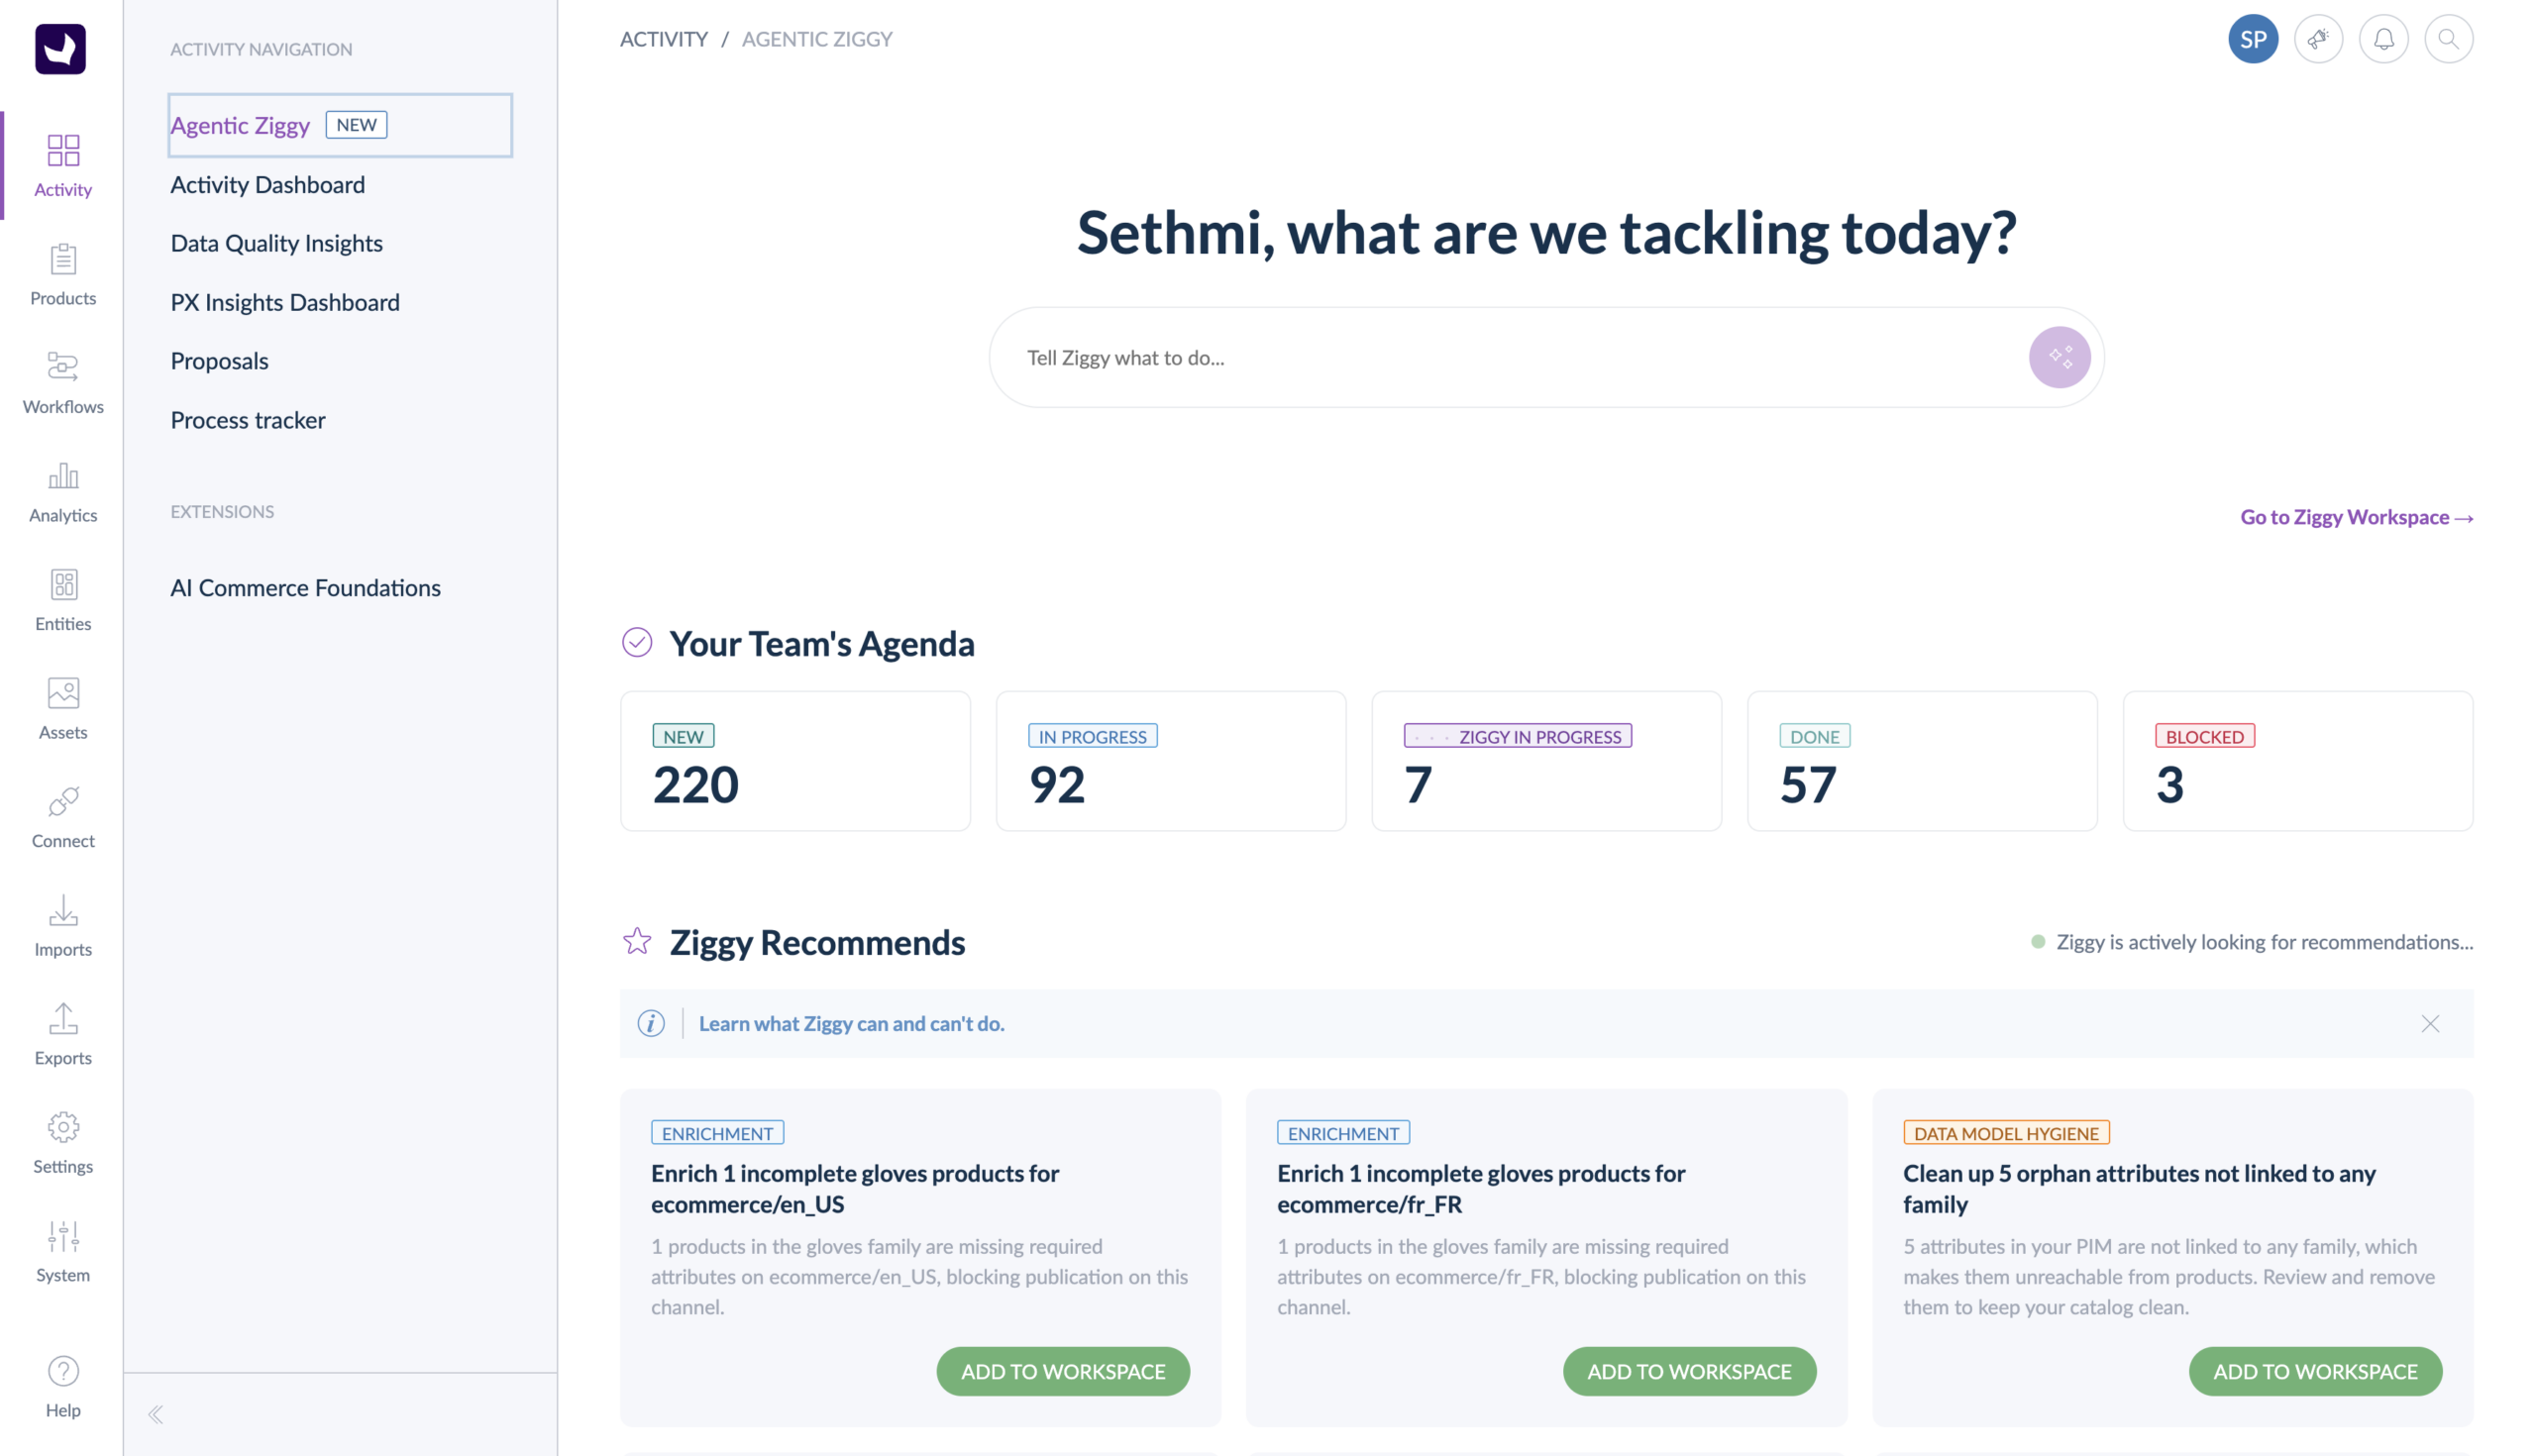
Meet Agentic Ziggy: Your AI Operational Layer
The headline of the Summer Release is Agentic Ziggy, and it’s a big one.
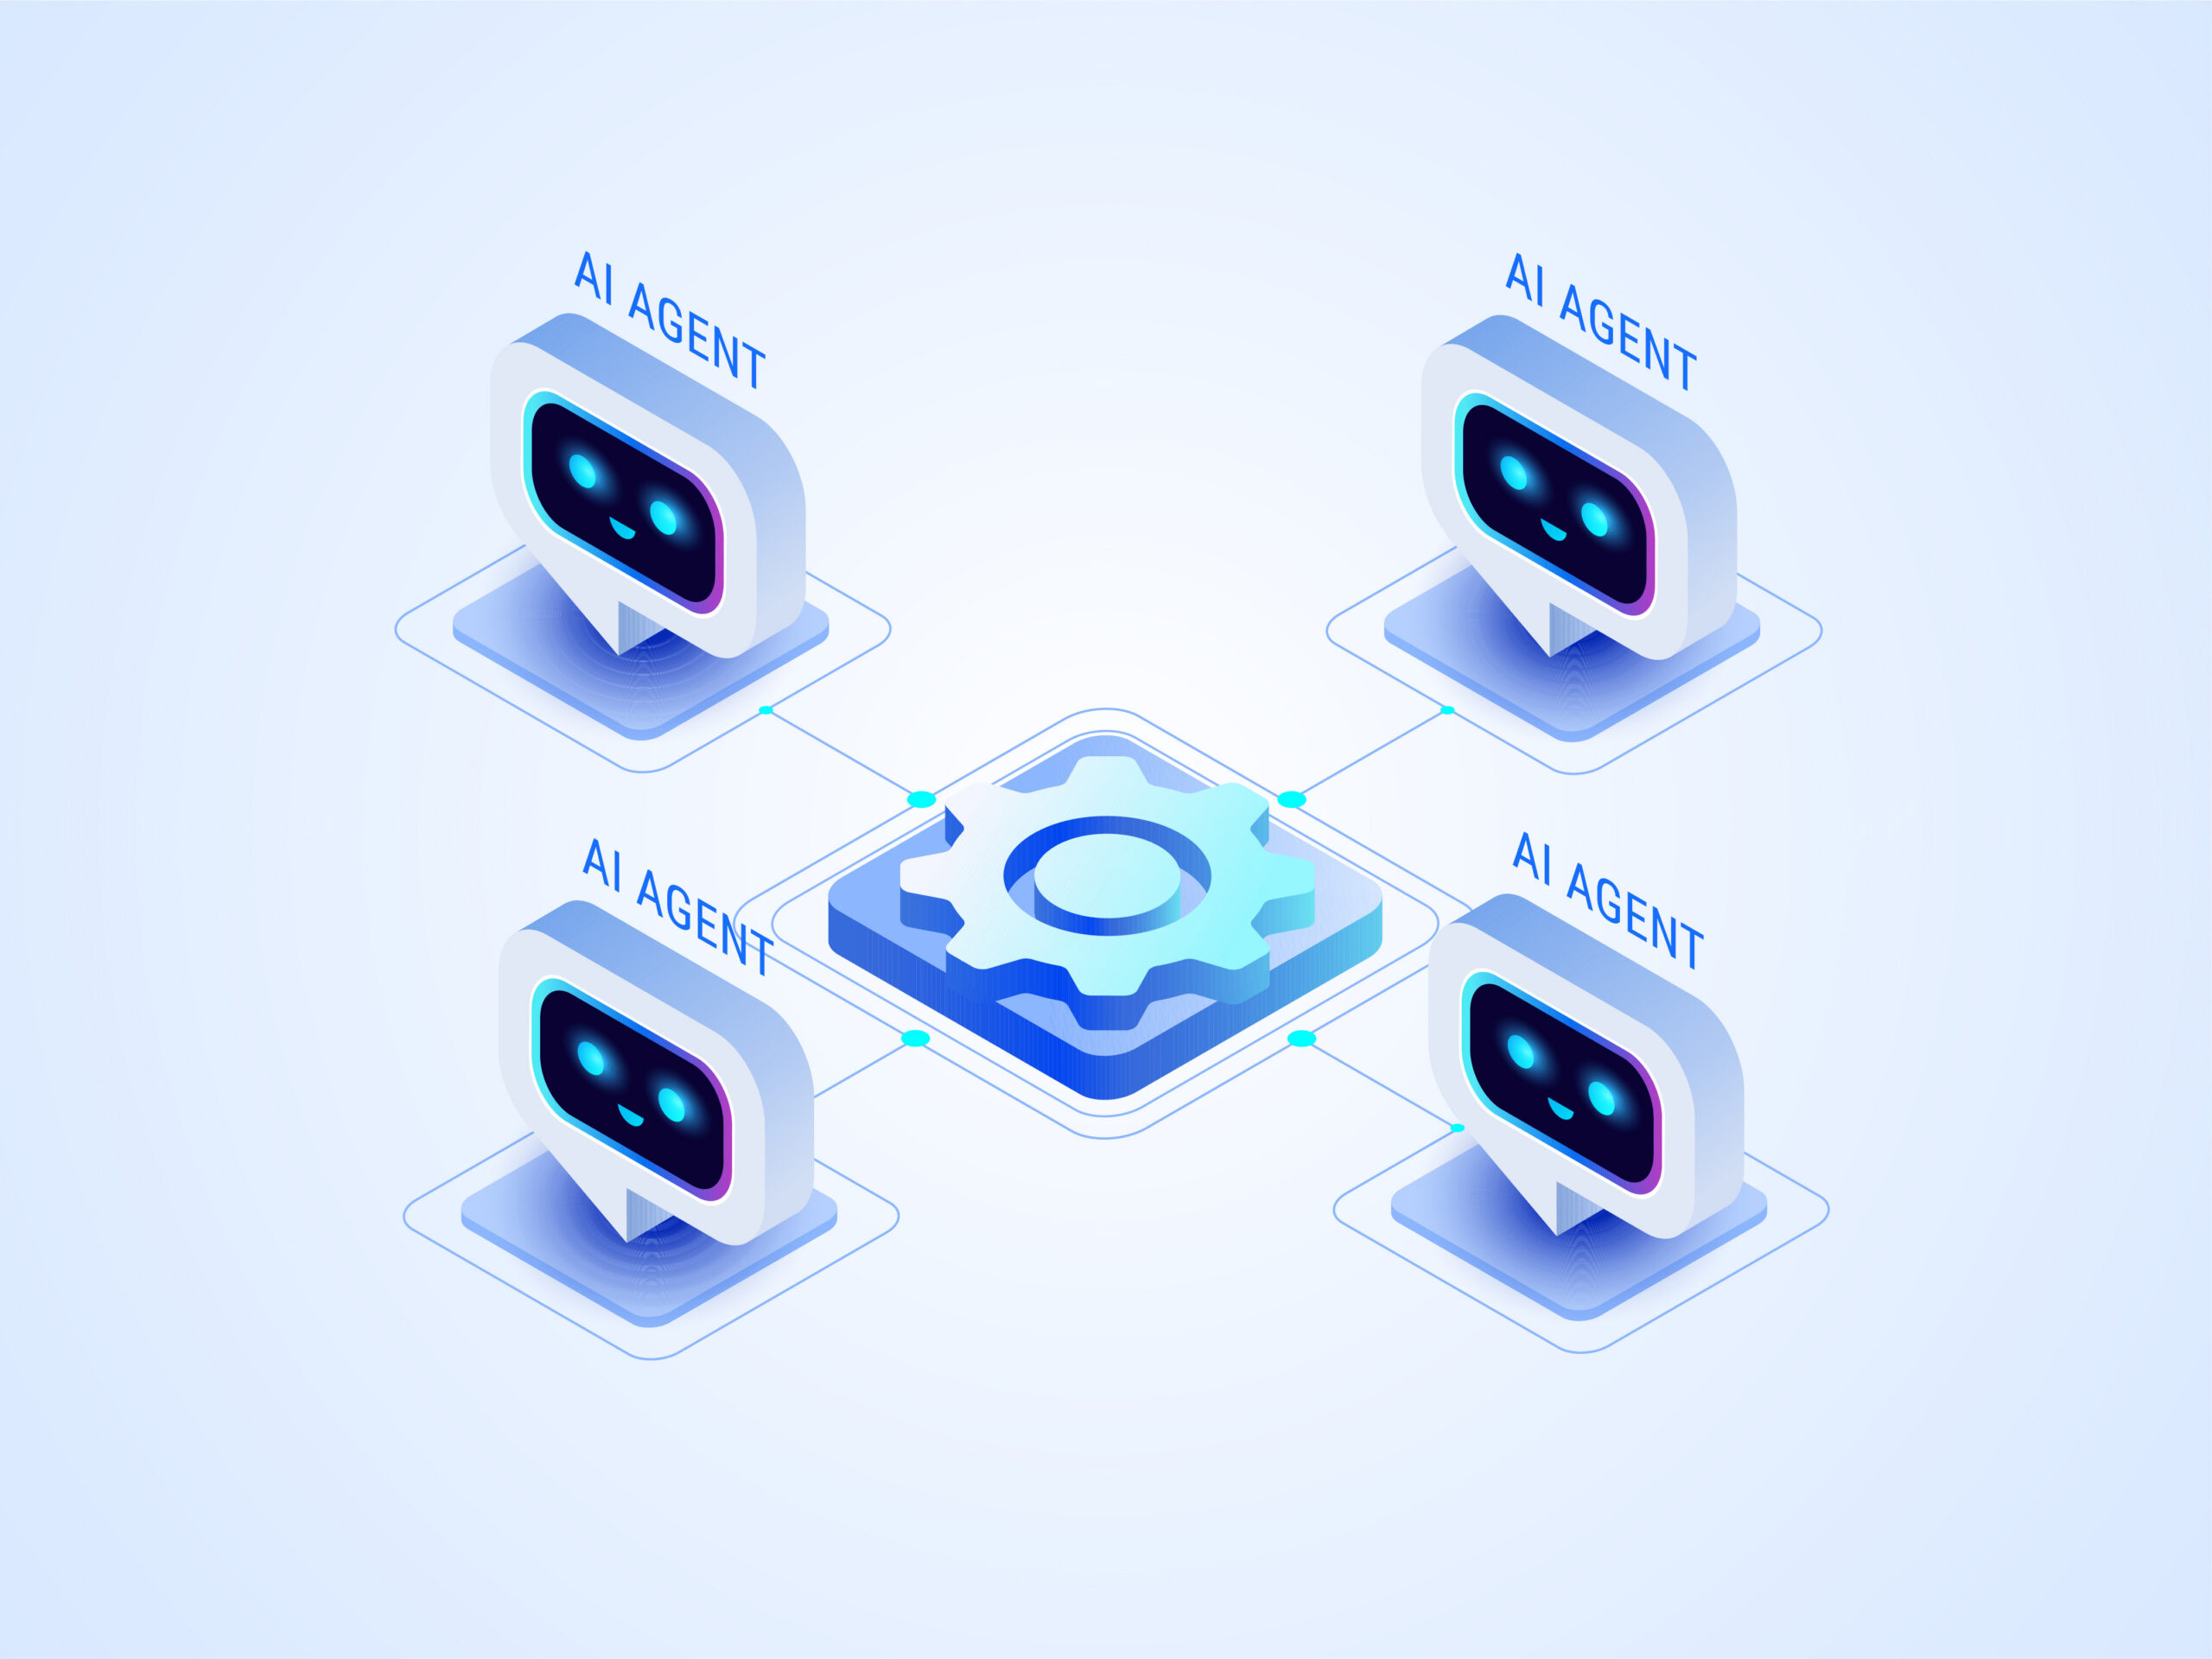
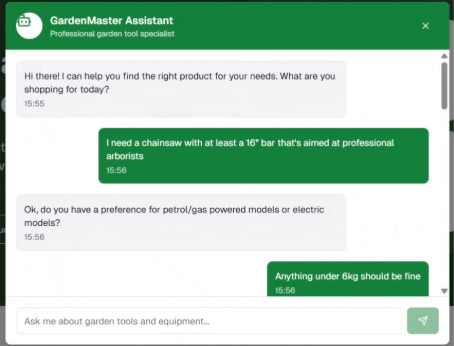
Agentic Ziggy introduces an AI-native workspace where teams can manage product experiences through intelligent agents rather than manual configuration. Instead of navigating complex menus or relying on technical specialists, users can guide outcomes through natural language interactions, letting coordinated AI agents handle the heavy lifting of product data workflows.
Think of it as augmenting your team with an intelligent layer that understands your objectives, recommends actions, and helps execute work across your entire product experience ecosystem. Whether you’re enriching data, preparing products for activation, or continuously optimizing experiences, Agentic Ziggy acts as an extension of your team, taking on repetitive, time-consuming tasks so your people can stay focused on the decisions that actually drive growth.
It’s important to note that this isn’t automation without oversight. Agentic Ziggy embeds governance directly into execution, ensuring teams can move faster without sacrificing the data integrity and control they depend on. Speed and data quality no longer have to be a trade-off.
For those already familiar with Ask Ziggy (the context-aware PIM assistant that helps users navigate complex configurations in real time), Agentic Ziggy builds on that foundation and takes it significantly further. Where Ask Ziggy guides, Agentic Ziggy acts.
“Agentic Ziggy has become the fastest way for our team to get clear, structured answers from our PIM data, with the added benefit of moving from question to action with the help of AI.”

AI-Powered Innovation Across the Entire Product Lifecycle
Agentic Ziggy is the star of the show, but the Summer Release also brings meaningful upgrades across every stage of the product experience lifecycle:
1. Smarter product modeling
With enhancements to the Data Architect Agent and the new Product Model Experience, building and evolving product architectures has become more intuitive than ever. What was once a technical exercise reserved for specialists is now a guided, accessible experience that supports faster onboarding, cleaner data structures, and better scalability.
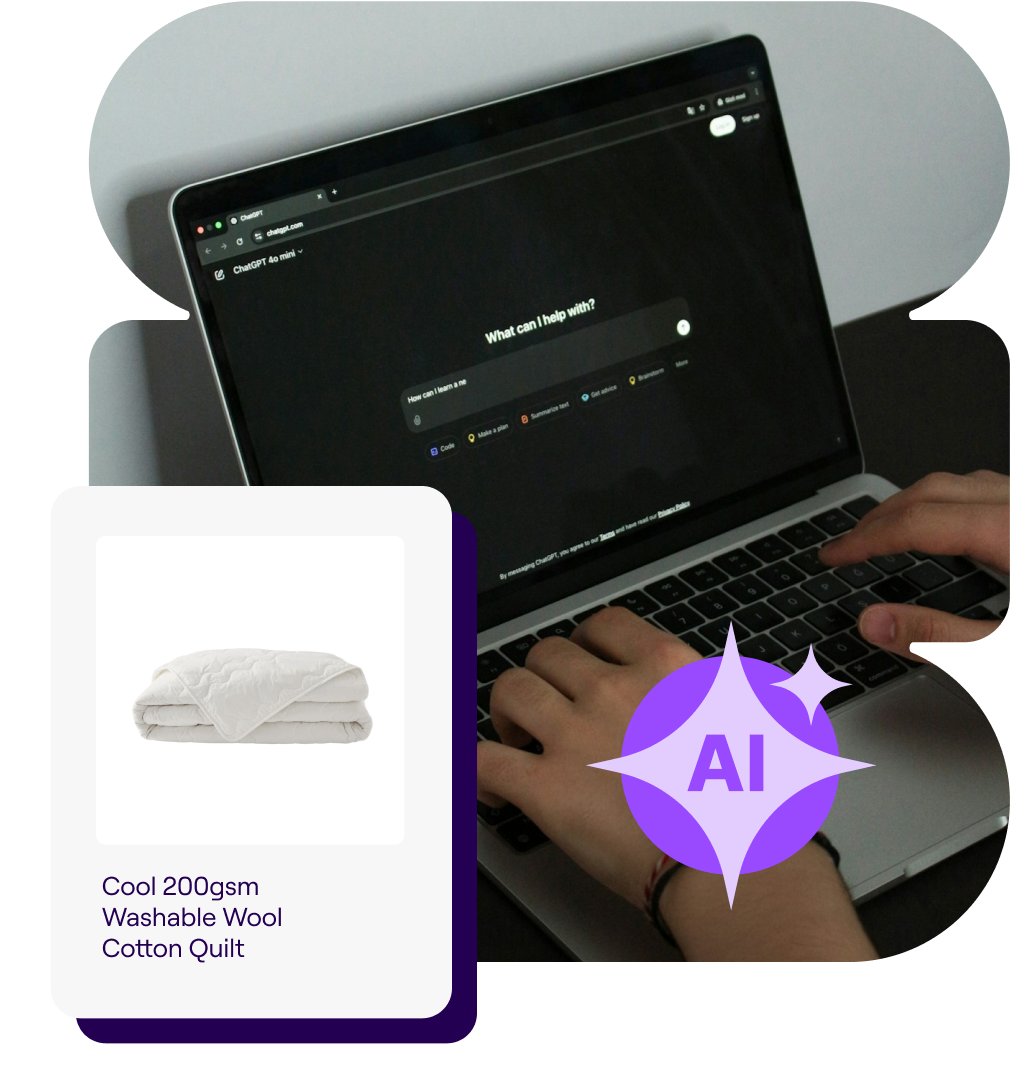
2. Image editing without the bottleneck
Akeneo DAM now supports prompt-based AI image transformations. Teams can modify product visuals using simple text instructions; for example, swapping backgrounds, adapting imagery for seasonal campaigns, or generating channel-specific variations, all without routing requests back to a design studio or spinning up external tools. Work that used to take days of back-and-forth can now be done in seconds, directly inside Akeneo.
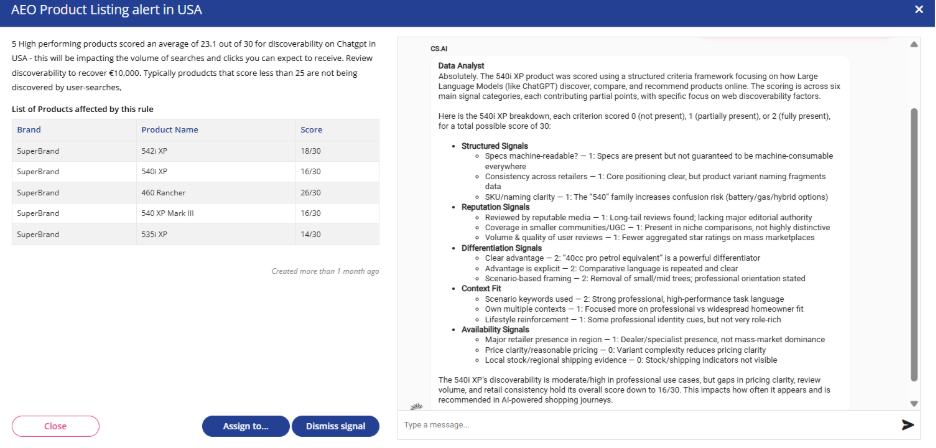
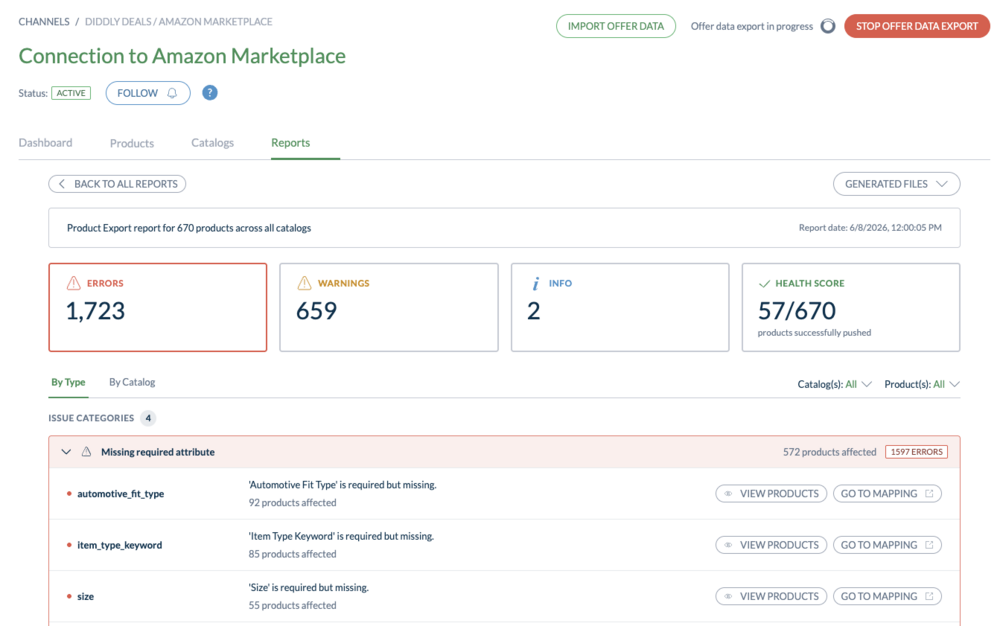
3. Activation that troubleshoots itself
Syndication errors have always been a drain on time and technical resources. Intelligent Error Management changes that by translating complex retailer errors into clear, actionable guidance that’s in the user’s own language. Teams can now self-serve their way through activation issues without needing deep technical expertise or constant support intervention.
4. Optimization that drives outcomes
By combining PX Insights with Agentic Ziggy, teams can move from identifying opportunities to acting on them in one seamless flow. Surface an AI readiness recommendation, understand the priority, and take action, all without leaving your workflow.
Why This Matters Now
Commerce teams are under more pressure than ever. More products, more channels, more personalized expectations. The traditional answer (add more headcount, add more process) doesn’t scale.
The smarter answer is augmenting your team with intelligent systems that can help complete work, recommend next steps, and continuously raise the bar on product experiences. That’s what Akeneo’s Agentic Product Cloud is built to deliver.
Ready to See It in Action?
Just like summer itself, this release brings a season of possibility; new tools, new ways of working, and a genuine opportunity to get ahead. Whether you’re looking to reduce manual effort, accelerate time to market, or simply do more with the team you already have, Agentic Ziggy and the Summer Release innovations are ready to help.
Join Akeneo’s upcoming Deminar to see Agentic Ziggy and the full Summer Release in action, and discover what it looks like when your product data starts working as hard as you do.
Akeneo’s 2026 Summer Release is Here.
Learn how Agentic Ziggy and new AI-powered capabilities within Akeneo Product Cloud help your team do more, faster.